New: AI-built dashboards you can share with one link. See what shipped →
Catchment boundaries, asset proximity, and utility network analysis from a single prompt.
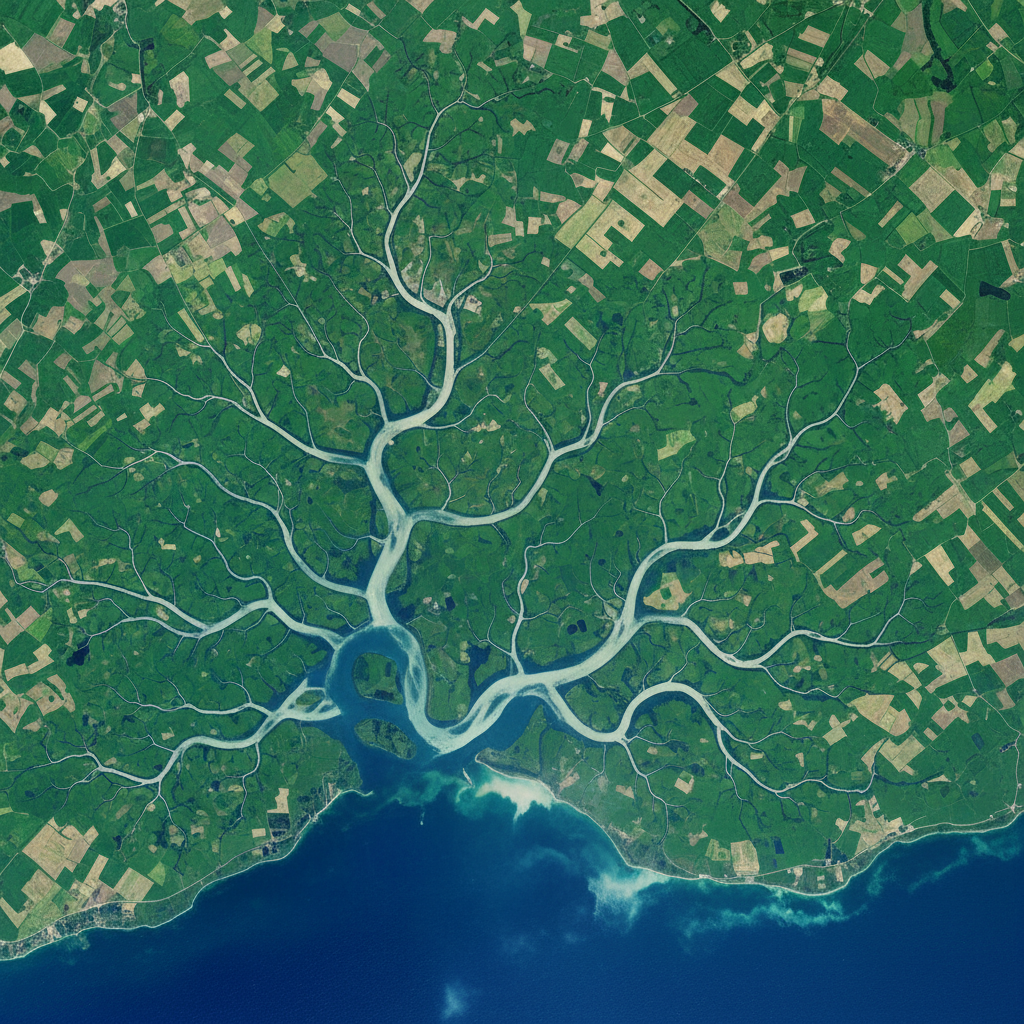
Water utilities and consultancies juggle dozens of vector layers — catchment polygons, pipeline networks, monitoring stations, parcel data — and still rely on manual GIS work to answer everyday questions about coverage, exposure, and proximity.
Web · vector workflows
Drop your shapefiles, GeoJSON, or GeoPackage into the workspace and ask. No install, free forever tier, results in seconds.
Spatially join existing catchment polygons with population, parcels, or service connections to quantify coverage and gaps.
› Join catchment boundaries with the village layer and total population served per catchment
Buffer wells, pumping stations, and pipelines to find affected parcels, encroachments, or compliance violations.
› Buffer all groundwater wells by 200m and list parcels with industrial land use inside
Run network ops on water and sewer line layers — connected components, downstream tracing, isolation valves.
› For this pipe network, find every parcel downstream of valve V-148 if it closes
Identify under-monitored areas by computing coverage from station point layers against catchment polygons.
› Show catchments with fewer than 2 monitoring stations within their boundary
Geocode complaint addresses and overlay against zone polygons to spot clusters and recurring hot zones.
› Geocode these 1,200 outage complaints and cluster them by service zone
Desktop · raster image processing
The desktop app runs Python on your machine — no timeouts, no upload limits, works air-gapped. Request access to get the build that fits your OS and use case.
Burn streams, fill sinks, and run flow accumulation on high-resolution DEMs to delineate watersheds at scale.
Combine DEM, river-stage data, and Manning roughness rasters to produce inundation depth maps.
Calculate cut-and-fill volumes from before/after DEMs or reservoir bathymetry for capacity studies.
One workspace
Start in the browser. Move to desktop when the dataset gets heavy. Projects sync — no re-importing, no re-prompting.
Describe the analysis. GeoPilot picks ops, runs them, returns map + data + report.
Buffers, joins, network analysis, choropleths — finishes in seconds, every plan.
Same chat continues against local Python. No timeouts, no upload caps.
Free vector tier. Desktop by request — tell us your OS, dataset size, and sensor type and we'll get back within one business day.