New: AI-built dashboards you can share with one link. See what shipped →
Portfolio exposure, hazard zone overlays, and claims geolocation for underwriters.
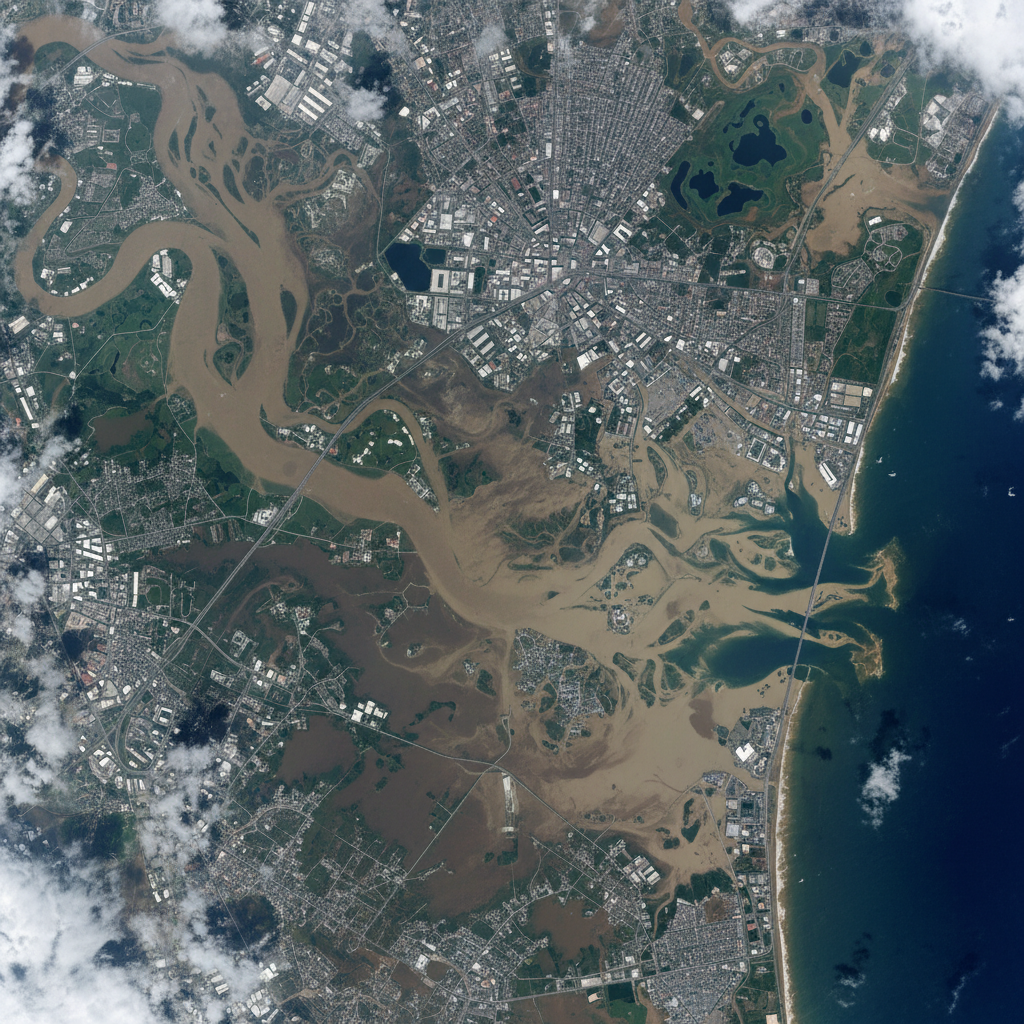
Insurers need to assess spatial risk for every policy — flood zones, fault lines, crime density, peril proximity — but lack in-house GIS. Vector overlays answer 80% of the questions; raster catastrophe modelling is the heavy 20%.
Web · vector workflows
Drop your shapefiles, GeoJSON, or GeoPackage into the workspace and ask. No install, free forever tier, results in seconds.
Overlay policy point locations against published flood, fault, and wildfire polygon layers.
› Show insured properties inside 100-year flood polygons and total insured value at risk
Cluster policy points by ZIP, district, or h3 cell to flag correlated-loss concentrations.
› Heat map of policy concentration; flag ZIPs above $10M aggregate exposure
Geocode claims addresses, cluster by location, and surface anomalous concentrations.
› Geocode these claims and run cluster analysis to highlight unusual hot spots
Compute distances from each insured asset to fault lines, coastlines, and hazardous facilities.
› For each property, compute distance to nearest fault, coastline, and chemical plant
Spatially join policies to CAT zones and roll up exposure for treaty reinsurance reporting.
› Aggregate sum-insured by CAT zone and export a treaty-ready exposure table
Desktop · raster image processing
The desktop app runs Python on your machine — no timeouts, no upload limits, works air-gapped. Request access to get the build that fits your OS and use case.
Sample wildfire intensity, flood depth, or wind-speed rasters at every policy location for per-policy scoring.
Compare pre/post-event satellite imagery to estimate building damage extent and claims load.
Run vendor or custom hazard models locally to produce raster footprints for portfolio overlays.
One workspace
Start in the browser. Move to desktop when the dataset gets heavy. Projects sync — no re-importing, no re-prompting.
Describe the analysis. GeoPilot picks ops, runs them, returns map + data + report.
Buffers, joins, network analysis, choropleths — finishes in seconds, every plan.
Same chat continues against local Python. No timeouts, no upload caps.
Free vector tier. Desktop by request — tell us your OS, dataset size, and sensor type and we'll get back within one business day.